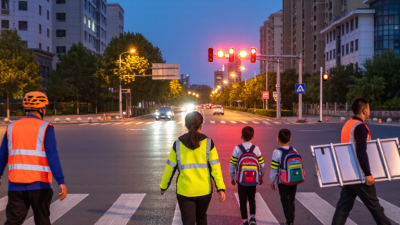
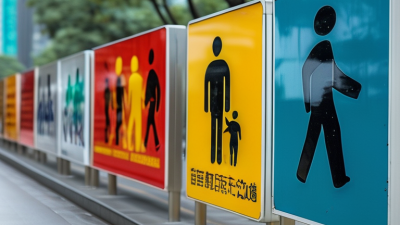
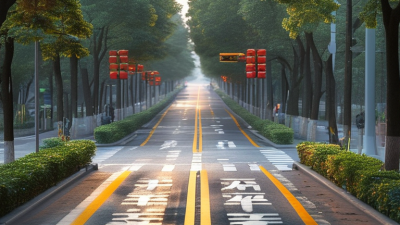
In 2026, pedestrian safety must become a daily design priority, not a slogan used after crashes. A safer street begins with what people experience at ground level: a clear crossing, a visible signal, and enough time to reach the opposite curb. It also depends on drivers seeing people before danger develops.
Dr. Etienne Krug, a leading road-safety expert at the World Health Organization, has stated, “Road traffic injuries are a major public health problem.” His observation places pedestrian safety within public health, not only transportation planning. The risks are visible in ordinary scenes: a parent guiding a child beside parked cars, an older adult waiting on a narrow island, or a delivery worker crossing after dark. These moments require practical protection.
Cities can improve conditions through slower traffic, raised crossings, brighter lighting, protected sidewalks, and safer junction layouts. Reliable data should guide these choices, including near-misses and complaints, not only reported injuries. Regular street audits can reveal blocked ramps, faded markings, or signals that change too quickly.
Technology may help. Cameras, connected signals, and vehicle alerts can support prevention. However, technology cannot repair a confusing road design by itself. Human judgment still matters.
No city gets this perfectly right. Some treatments may work poorly in local conditions. That uncertainty deserves honest evaluation. Planners should test changes, listen to residents, and measure results over time. The strongest approach combines professional evidence with lived experience. In this guide, we examine practical steps for making walking safer, clearer, and more dignified throughout 2026.
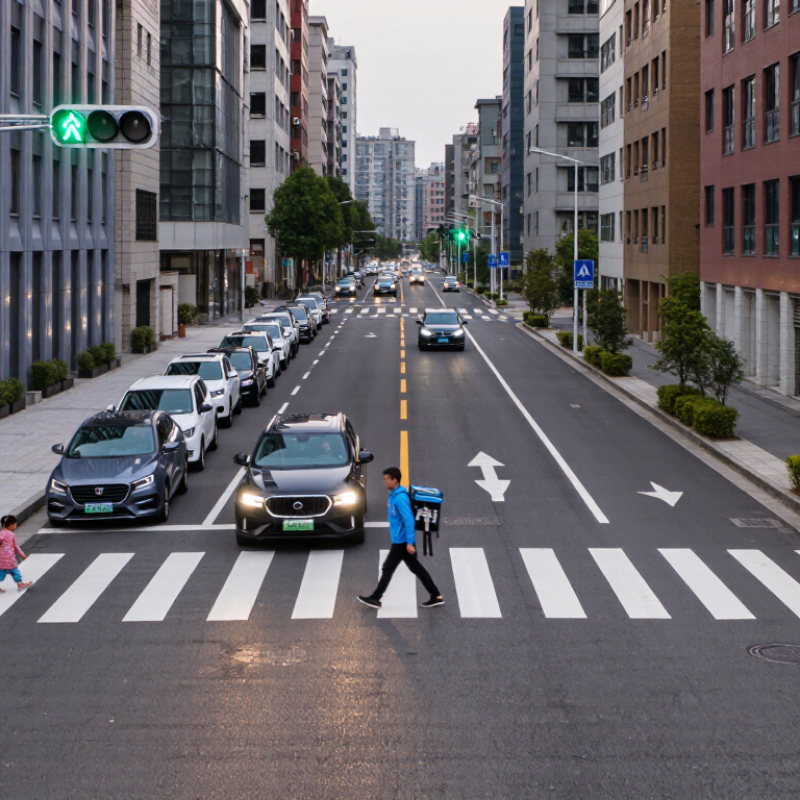
Pedestrian injuries rarely come from one mistake. They usually emerge from speed, distraction, poor visibility, and unsafe street design. The World Health Organization’s Global Status Report on Road Safety 2023 estimates that pedestrians represent about 23% of global road deaths. This figure exposes a basic weakness: many streets still prioritize vehicle movement over human survival.
Speed is especially important. A faster vehicle gives drivers less time to react and pedestrians less chance of survival. The U.S. National Highway Traffic Safety Administration reported 7,522 pedestrian deaths in 2022. Nighttime conditions, wide crossings, and missing sidewalks increase exposure. Street audits often reveal practical details, such as faded markings, blocked sightlines, and people waiting beside fast-moving traffic. Small design failures matter.
Distraction adds another layer. A driver checking a message may miss a person stepping from behind a parked vehicle. A pedestrian wearing headphones may not hear an approaching engine. However, blaming individuals alone is too simple. Infrastructure should anticipate ordinary human mistakes. Better lighting, shorter crossings, raised intersections, and lower operating speeds can reduce injury severity. Data also has limits because countries classify crashes differently. That uncertainty deserves attention. A safer 2026 requires local injury records, hospital evidence, and repeated on-site observation, not assumptions based only on national averages.
Safer streets begin with crossings that match human behavior, not ideal behavior.
Raised crosswalks slow turning vehicles before they reach people. Curb extensions shorten crossing distances and improve visibility near parked cars. Clear sightlines matter most at dusk, when headlights and shadows hide pedestrians. Designers should also provide even sidewalks, tactile paving, audible signals, and enough crossing time for older adults and wheelchair users.
Small details can prevent serious mistakes. A crossing should be visible from a driver’s approach, with lighting placed to illuminate people, not only the road surface. Signal timing should reflect real walking speeds, including slower users. Local teams can review collision records, observe near-misses, and speak with residents during evening audits. Numbers help, but lived experience reveals problems that surveys may miss. A painted line alone is not protection. Nor is a bright sign beside a confusing intersection.
Every project needs testing after construction. Engineers can compare vehicle speeds, yielding rates, and reported conflicts before and after changes. Temporary materials may expose weaknesses before permanent work begins. Some designs will fail to serve every street equally. That should be acknowledged, not hidden. Maintenance also matters: faded markings, blocked ramps, and broken lights quietly reduce safety. Streets must be inspected in rain, darkness, and heavy traffic, when neat plans meet imperfect reality.
Pedestrian safety in 2026 will depend on practical technology, not futuristic promises. The World Health Organization reported about 1.19 million road deaths worldwide in 2023. More than half involved pedestrians, cyclists, or motorcyclists. A person crossing at dusk remains difficult for drivers and sensors to detect.
Vehicle-based pedestrian detection can reduce this risk. Cameras, radar, and thermal sensors can identify a moving figure near a crosswalk. Automatic emergency braking can then warn the driver or apply the brakes.
The United States National Highway Traffic Safety Administration recorded 7,388 pedestrian deaths in 2022. That figure shows why detection must work beyond daylight and clear weather. Systems should also detect children, wheelchair users, and people partly hidden by parked vehicles. Small details matter.
Roadside technology adds another protective layer. Smart crossings can measure speed, illuminate waiting areas, and send alerts to approaching vehicles. Connected signals may warn drivers before a pedestrian steps into traffic. However, technology can fail. Rain, glare, poor maintenance, and false alarms still create serious weaknesses. Drivers may also trust automated warnings too much. That is a human problem. The Insurance Institute for Highway Safety has found that pedestrian crashes have become more severe as vehicle designs grow taller and heavier. Engineers should publish real-world performance data, not only laboratory results. Cities also need transparent testing near schools, bus stops, and poorly lit intersections. One missed person is enough to question the entire system.
Pedestrian safety in 2026 will depend on shared awareness, not technology alone. Drivers need to expect people near every crossing, driveway, and bus stop. A clear view can disappear behind a parked vehicle. Slowing down creates time to react. Eye contact helps, but it is never a guarantee. Pedestrians should also pause before crossing, even when the signal allows movement. Looking left, right, and left again remains practical advice.
Small habits can prevent serious mistakes. Drivers should scan beyond the vehicle ahead, especially near schools and residential streets. They should avoid phone use and reduce speed in rain, fog, or darkness. Pedestrians can choose visible clothing and cross where lighting is strong. A raised hand may show intention, but it cannot stop a moving car. Awareness must include uncertainty.
Street audits and local crash records can reveal dangerous patterns that casual observation misses. These reviews should include residents, drivers, people with disabilities, and traffic professionals. Their perspectives often expose confusing signs, faded markings, or crossings that take too long. I have noticed that even careful people become rushed when signals change quickly. That weakness deserves attention. Safer streets require patient decisions from everyone, every day.
Improving Driver and Pedestrian Awareness
Pedestrian fatalities in the United States increased from 6,283 in 2018 to 7,522 in 2022. This trend highlights the importance of safer driving speeds, attentive driving, visible crossings, and pedestrians making eye contact with drivers before crossing.
Source: U.S. National Highway Traffic Safety Administration, Traffic Safety Facts: Pedestrians, annual national estimates.
Improving pedestrian safety in 2026 requires more than installing signs or repainting crossings. Cities need reliable measures that reveal whether policies work. The World Health Organization reported about 1.19 million road deaths worldwide in 2021. Vulnerable road users represented more than half of those deaths. These figures justify stronger local monitoring.
A practical dashboard should track pedestrian deaths, serious injuries, vehicle speeds, and walking exposure. It should also record near misses near schools, transit stops, and poorly lit intersections. The United States National Highway Traffic Safety Administration recorded 7,314 pedestrian deaths in 2023. However, near-miss data remains inconsistent. That weakness needs attention. A quiet intersection may reflect underreporting, not safety.
Policy reviews should happen quarterly, using police records, hospital data, street observations, and community reports. If drivers regularly exceed the posted limit near a crossing, planners should reassess road design, signal timing, and lighting. The Global Status Report on Road Safety 2023 supports a Safe System approach, which accepts human error and limits its consequences. Field audits matter. A curb ramp blocked by parked vehicles can defeat an otherwise strong plan. Pilot projects may also fail, and officials should publish those results instead of hiding them. Equity checks should compare outcomes across neighborhoods, ages, disabilities, and income levels. Measuring progress means changing policy when the evidence is uncomfortable.
A data-based comparison of pedestrian fatalities, road-safety trends, and policy priorities.
| Geography | Year | Indicator | Reported Value | Change / Share | 2026 Policy Focus | Source |
|---|---|---|---|---|---|---|
| Worldwide | 2021 | Estimated annual road-traffic deaths | 1.19 million | Baseline | Adopt a Safe System approach and publish annual, mode-specific safety targets. | World Health Organization, Global Status Report on Road Safety 2023 |
| Worldwide | 2021 | Pedestrian share of global road deaths | 23% | Vulnerable road users: 53% | Prioritize protected crossings, continuous footpaths, lighting, and lower vehicle speeds. | World Health Organization, Global Status Report on Road Safety 2023 |
| United States | 2022 | Pedestrian fatalities | 7,388 | 17.4% of all traffic deaths | Expand proven countermeasures at high-risk intersections and along high-speed corridors. | National Highway Traffic Safety Administration, 2022 Traffic Safety Facts |
| United States | 2023 | Pedestrian fatalities | 7,314 | 1.0% decrease from 2022 | Track progress by road type, neighborhood, age, and time of day rather than using national totals alone. | National Highway Traffic Safety Administration, 2023 Traffic Safety Facts |
| United States | 2022–2023 | All traffic fatalities | 42,514 → 40,901 | 3.8% decrease | Ensure pedestrian safety improves faster than the overall road-safety trend. | National Highway Traffic Safety Administration, 2022–2023 traffic fatality estimates |
| European Union | 2023 | Road-traffic fatalities | Approximately 20,400 | 1% decrease from 2022 | Accelerate action on urban speed management, safe infrastructure, and enforcement. | European Commission, preliminary road-safety statistics for 2023 |
| European Union | 2019–2023 | Change in road deaths | About 10% decrease | Below the 2019–2030 target path | Use interim milestones and corrective measures when annual reductions fall behind target. | European Commission, road-safety performance review |
| Great Britain | 2023 | Pedestrian fatalities | 385 | Reported annual total | Combine casualty data with walking exposure, deprivation, speed, and street-design indicators. | Department for Transport, Reported Road Casualties Great Britain: 2023 |
| Australia | 2023 | Pedestrian fatalities | 204 | 16.1% of all road deaths | Set local safety programs using pedestrian exposure and vulnerable-location analysis. | Australian Government Bureau of Infrastructure and Transport Research Economics, Road Deaths Australia 2023 |
| Global policy benchmark | 2030 target | Reduction in road deaths and injuries | At least 50% | Relative to the 2021 baseline | Use 2026 as a formal review year for funding, enforcement, infrastructure, and data quality. | United Nations, Global Plan for the Decade of Action for Road Safety 2021–2030 |